

Cassini tastes organic material at Enceladus (with video)
Scientists are amazed that this tiny moon is so active, "hot" and brimming with water vapor and organic chemicals.
«« New structure, density and composition measurements of Enceladus' water plume were obtained when the Cassini spacecraft's Ultraviolet Imaging Spectrograph observed the star zeta Orionis pass behind the plume Oct. 24, 2007, as seen in this animation. Changes in the starlight as it dimmed while passing through the plume allowed the spectrograph to identify the plume's physical and chemical composition. The spectrograph detected four high-density gas streams composed of water vapor. The density of the water vapor is twice that of the broad plume of gas that surrounds each jet. This measurement confirms the theoretical analysis performed prior to the flyby that showed it was safe for Cassini to fly very closely past Enceladus, even through part of the plume, during the March 12, 2008 flyby. Credit: NASA/JPL/University of Colorado/SSI.
New heat maps of the surface show higher temperatures than previously known in the south polar region, with hot tracks running the length of giant fissures. Additionally, scientists say the organics "taste and smell" like some of those found in a comet. The jets themselves harmlessly peppered Cassini, exerting measurable torque on the spacecraft, and providing an indirect measure of the plume density.
"A completely unexpected surprise is that the chemistry of Enceladus, what's coming out from inside, resembles that of a comet," said Hunter Waite, principal investigator for the Cassini Ion and Neutral Mass Spectrometer at the Southwest Research Institute in San Antonio. "To have primordial material coming out from inside a Saturn moon raises many questions on the formation of the Saturn system."
"Enceladus is by no means a comet. Comets have tails and orbit the sun, and Enceladus' activity is powered by internal heat while comet activity is powered by sunlight. Enceladus' brew is like carbonated water with an essence of natural gas," said Waite.
The Ion and Neutral Mass Spectrometer saw a much higher density of volatile gases, water vapor, carbon dioxide and carbon monoxide, as well as organic materials, some 20 times denser than expected. This dramatic increase in density was evident as the spacecraft flew over the area of the plumes.
New high-resolution heat maps of the south pole by Cassini's Composite Infrared Spectrometer show that the so-called tiger stripes, giant fissures that are the source of the geysers, are warm along almost their entire lengths, and reveal other warm fissures nearby. These more precise new measurements reveal temperatures of at least minus 93 degrees Celsius (minus 135 Fahrenheit.) That is 17 degrees Celsius (63 degrees Fahrenheit) warmer than previously seen and 93 degrees Celsius (200 degrees Fahrenheit) warmer than other regions of the moon. The warmest regions along the tiger stripes correspond to two of the jet locations seen in Cassini images.
"These spectacular new data will really help us understand what powers the geysers. The surprisingly high temperatures make it more likely that there's liquid water not far below the surface," said John Spencer, Cassini scientist on the Composite Infrared Spectrometer team at the Southwest Research Institute in Boulder, Colo.

Credit: NASA/JPL/University of Colorado/SSI.
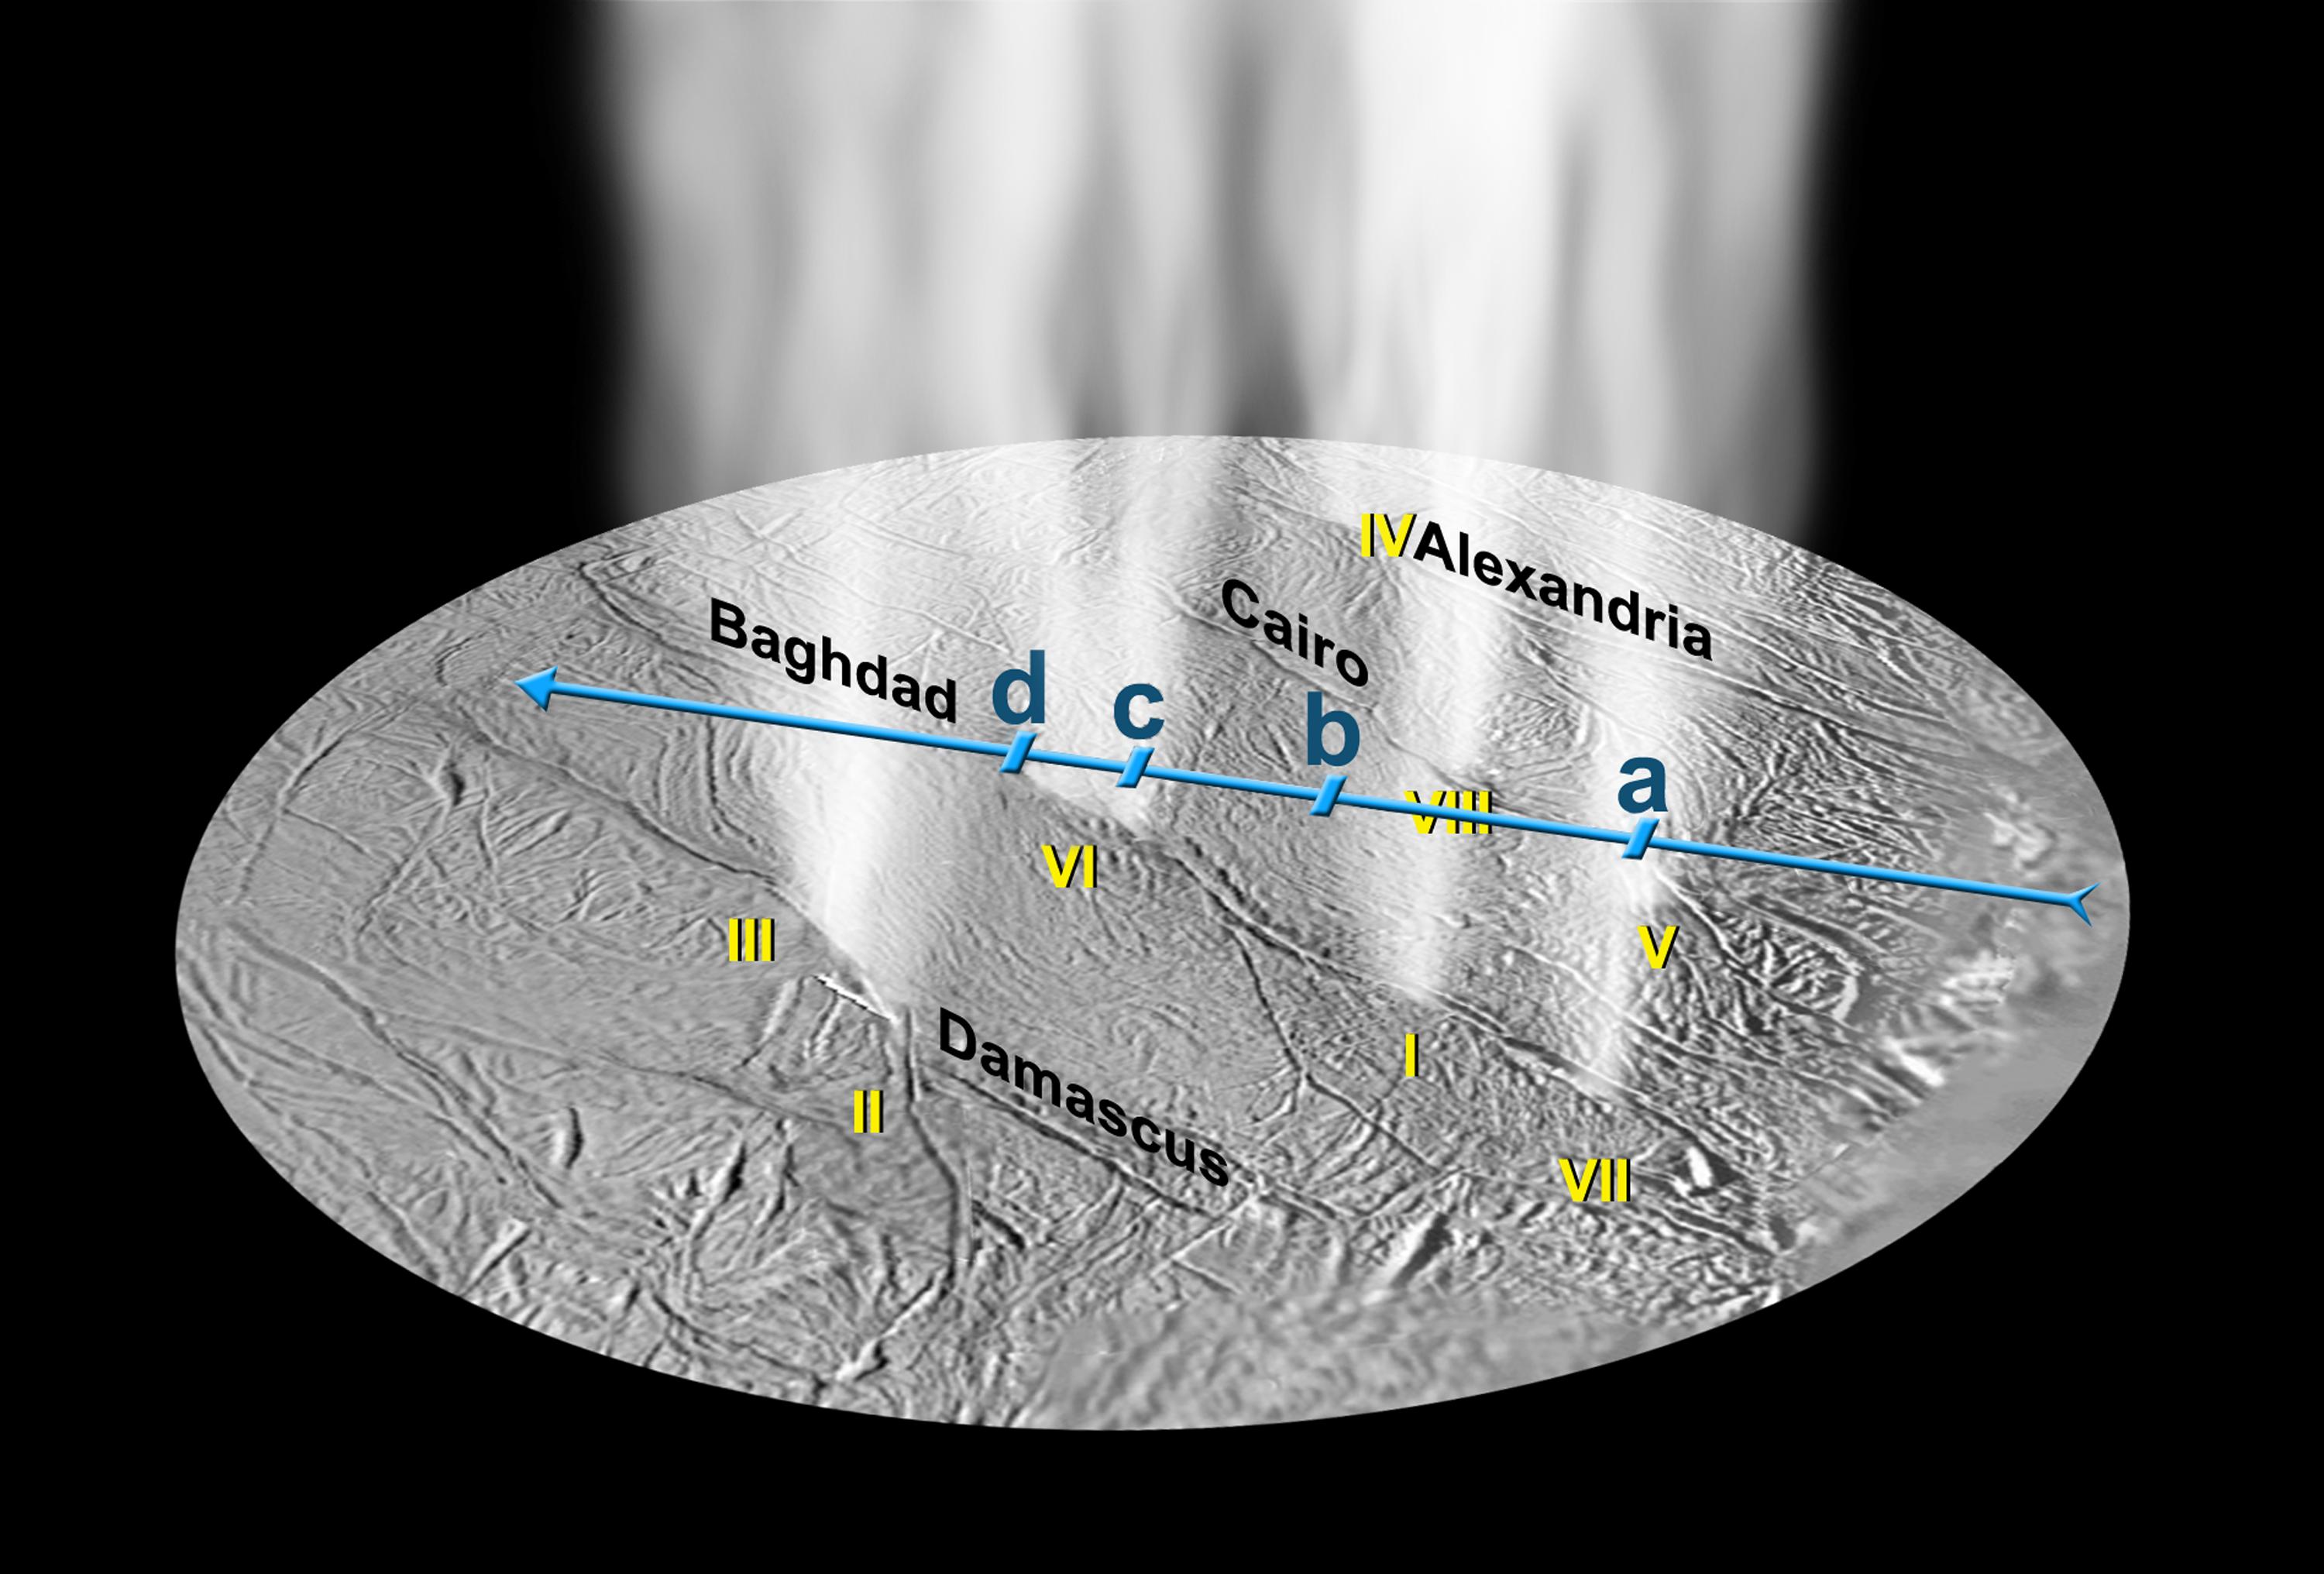
Jets of high-density gas detected by Cassini's Ultraviolet Imaging Spectrograph on Saturn's moon Enceladus match the locations of dust jets determined from Cassini images, labeled here with Roman numerals. The spectrograph pinpointed the locations of individual gas streams in the plume in a "stellar occultation," which involves measuring the light of a star (in this case, zeta Orionis), as it passed behind the plume from Cassini's viewpoint.
The blue line in this projection shows the path of the starlight through the plume, over the south polar region of Enceladus. The instrument looked at the star across this path in the direction indicated by the short blue lines.
Some of the dust jets appear to merge together in stellar occultation data. The dimming of starlight labeled "a" was caused by dust jets V and VII. The dimming of starlight marked as feature "b" may be associated with dust jet I if the jet is not perfectly vertical. Dimming of starlight labeled "c" corresponds to dust jet VI, and "d" is dust jet III, with dust jet II in between. The individual jets come from sources with an area of less than 300 by 300 meters (1,000 feet square)--about the size of half a tennis court--probably stretched out rectangularly along the tiger stripes. The new data indicate that the water molecules are blasting off from Enceladus at faster than 600 meters per second (about 1,200 miles per hour).

Credit: NASA/JPL/SwRI.
The lower panel is a mass spectrum that shows the chemical constituents sampled in Enceladus' plume by Cassini's Ion and Neutral Mass Spectrometer during its fly-through of the plume on Mar. 12, 2008. Shown are the amounts, in atomic mass per elementary charge (Daltons [Da]), of water vapor, methane, carbon monoxide, carbon dioxide, simple organics and complex organics identified in the plume.

Credit: NASA/JPL/SwRI.
Enceladus' plume was found to have a comet-like chemistry by Cassini's Ion and Neutral Mass Spectrometer during its fly-through of the plume on Mar. 12, 2008. Water vapor, methane, carbon monoxide, carbon dioxide, simple organics and complex organics were identified in the plume. The graph shows the chemical constituents in percentage of abundance found in comets compared to those found in Enceladus' plume.

Credit: NASA/JPL/GSFC/SwRI/SSI.
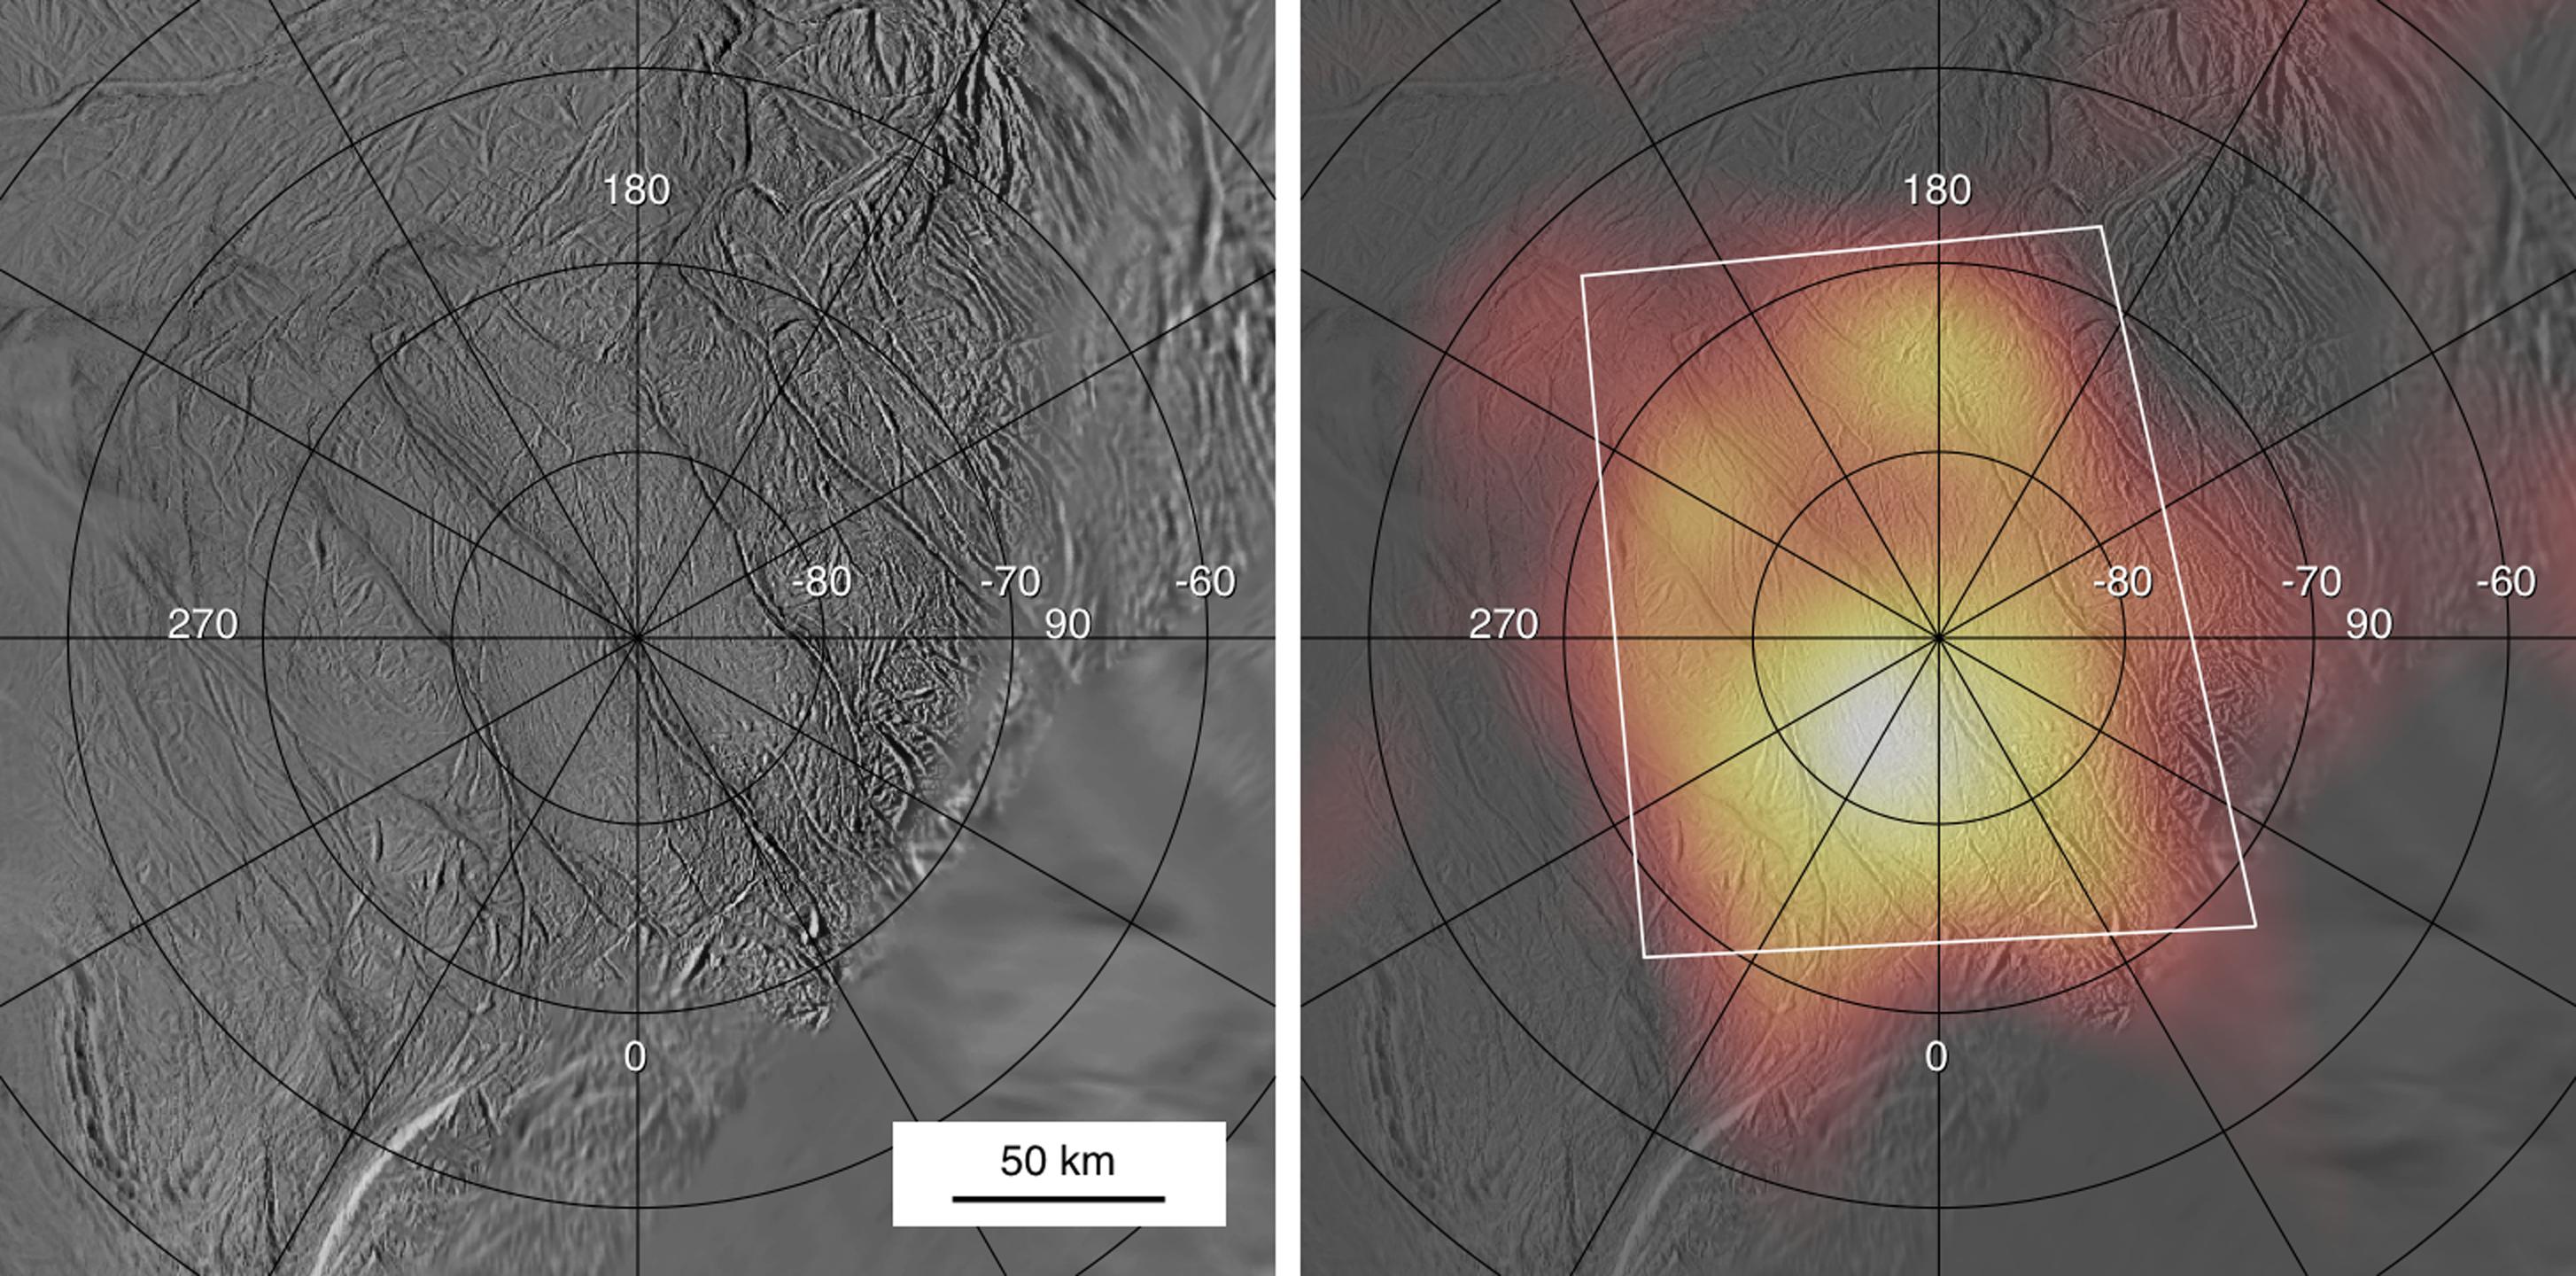
Cassini's March 12, 2008, flyby of Enceladus provided the best view yet of the heat radiation from the active south pole of the satellite. These images summarize what was learned about the south polar landscapes and heat radiation during the previous close flyby on July 15, 2005.
The left panel shows a map of the south pole constructed from images taken by the spacecraft's imaging system. Four prominent fractures, informally called "tiger stripes," cut diagonally across the south polar region. In the right-hand panel, a July 2005 map of the south polar heat radiation, obtained by Cassini's Composite Infrared Spectrometer, is superimposed in false color on the visible images. The observations revealed a prominent warm region centered on the south pole, appearing yellow and orange in this view, which coincides with the locations of the tiger stripes. However, these data were taken from too far away from Enceladus (about 80,000 kilometers or 50,000 miles) to distinguish the fine details of the heat radiation. The July 2005 flyby also included some scattered close-up snapshots by the Composite Infrared Spectrometer; these showed that the heat radiation was concentrated along the tiger stripe fractures, but those snapshots covered only a small fraction of the south polar region.
The white lines enclose the area covered by the much more detailed view of the south pole obtained by the spectrometer during the March 12, 2008, flyby. Numbers on the map show latitude and longitude.

Credit: NASA/JPL/GSFC/SwRI/SSI.
Heat radiating from the entire length of 150 kilometer (95 mile)-long fractures is seen in this best-yet heat map of the active south polar region of Saturn's ice moon Enceladus. The warmest parts of the fractures tend to lie on locations of the plume jets identified in earlier images, shown with yellow stars. The measurements were obtained by the Cassini spacecraft's Composite Infrared Spectrometer from the spacecraft's close flyby of the moon on March 12, 2008.
Remarkably high temperatures, at least 180 Kelvin (minus 135 degrees Fahrenheit) were registered along the brightest fracture, named Damascus Sulcus, in the lower left portion of the image. For comparison, surface temperatures elsewhere in the south polar region of Enceladus are below 72 Kelvin (minus 330 degrees Fahrenheit).
Heat is escaping from Enceladus' interior along these warm fractures, dubbed "tiger stripes," which are also the source of the geysers that erupt from the polar region. The infrared radiation was mapped at wavelengths between 12 and 16 microns. The infrared data, shown in false color, are superimposed on a grayscale image mosaic of the south pole obtained by Cassini's cameras on July 14, 2005, during the previous close Enceladus flyby. Numbers on the map indicate latitude and longitude.
This new view shows that at least three of the south polar fractures are active along almost their full lengths—the fourth one, on the right, was only partially covered by this scan. The level of activity varies greatly along the fractures. The warmest parts of the fractures tend to lie on locations of the plume jets identified in earlier images. The main "tiger stripe" fractures are not the only sources of heat, however; additional warm spots are seen in the upper right part of the scan. The warm regions are probably concentrated within less than a few hundred meters (a few hundred yards) of the fractures, and their apparent width in this image results from the relatively low resolution of the infrared data.
This map was made by scanning the south pole during the period from 16 to 37 minutes after closest approach to Enceladus, at a distance between 14,000 and 32,000 kilometers (about 8,700 and 20,000 miles) as Cassini rapidly receded from its close (50-kilometer or 32-mile) flyby.

Credit: NASA/JPL/SwRI/SSI.
The number of water particles in Enceladus' plume peaked over the area highlighted by the circle in this image of Enceladus, which is overlain by data from Cassini's Ion and Neutral Mass Spectrometer, and the spacecraft's trajectory, during its fly-through of the plume on March 12, 2008.
Previous ultraviolet observations showed four jet sources, matching the locations of the plumes seen in previous images. This indicates that gas in the plume blasts off the surface into space, blending to form the larger plume.
Images from previous observations show individual jets and mark places from which they emanate. New images show how hot spot fractures are related to other surface features. In future imaging observations, scientists hope to see individual plume sources and investigate differences among fractures.
"Enceladus has got warmth, water and organic chemicals, some of the essential building blocks needed for life," said Dennis Matson, Cassini project scientist at NASA's Jet Propulsion Laboratory in Pasadena, Calif. "We have quite a recipe for life on our hands, but we have yet to find the final ingredient, liquid water, but Enceladus is only whetting our appetites for more."
At closest approach, Cassini was only 30 miles from Enceladus. When it flew through the plumes it was 120 miles from the moon's surface. Cassini's next flyby of Enceladus is in August.
| Source: Jet Propulsion Laboratory | |
 |
More on • Cassini |
spacespin.org/article.php/80344-cassini-organic-material-enceladus