Housing and Banking Deception: 23,000 to 28,000 Foreclosed Homes kept off the MLS or Public View in California each Month.
The math in California housing simply does not add up. Given the amount of sales and monthly foreclosures over the past few months, it would appear that banks are sitting back while a gigantic backlog of foreclosures grows. A few in the media are calling attention to this obvious fraud but not many. The California housing market is reeling from an epic mulit-decade long real estate bubble. For the past few months, foreclosures have been hitting at a record pace yet the official MLS inventory is falling lower and lower. I have pulled up data for the largest California counties with MLS data from March and compared it to July and what you will see is simply astonishing. I will compare this data with actual foreclosures and what you see is banks are taking homes back, failing to list them on the MLS, and basically sitting back probably hoping the government bails them out.
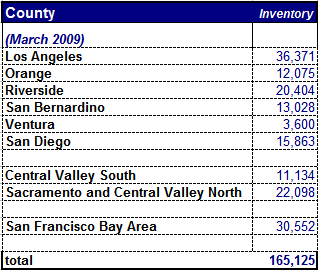
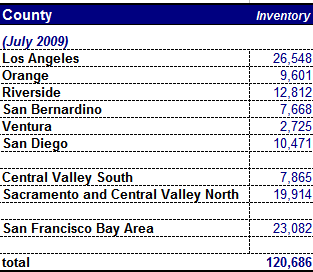
Let us first look at the March and July snapshots of inventory:
*Source: MLS data
As many of you know, the spring and summer are usually the hottest selling seasons and this normally will see both a jump in sales but also inventory. What we see here instead is a massive drop in inventory of 26 percent in 4 months! This data here isn’t the big shocker however. When we start looking at sales and actual foreclosures, that is when we start realizing something is terribly amiss:
*Source: DataQuick
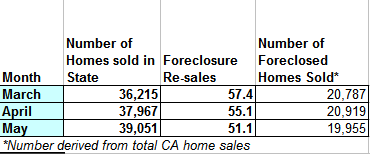
It is safe to assume that for June, taking an average from the past 3 months would give us a total of 38,000 to 40,000 additional homes sold in California for last month. So with that information, we can add the last 4 months to see that a total of approximately 151,000+ homes sold in California. Looking at our list of the largest California counties, we notice that the list on the MLS dropped by 44,439. But we know that over half of homes sold are foreclosure re-sales. This means in the last four months out of the 151,000 homes sold in California, some 75,000 to 80,000 homes that sold were distressed properties.
And here is where the major data discrepancies begin for the California housing market. Let us look at the distress inventory for this same timeframe:
In the same time that California was selling an average of 38,000 homes a month, an average 47,000 homes were being foreclosed on. So even looking at this basic data set for 4 months, we know that in March 20,787 homes that sold were foreclosure re-sales. But during March, we know that California had 48,927 actual foreclosures (we aren’t counting the 58,959 notice of defaults that will become foreclosures in 6 to 9 months). This pattern holds for April and May and I would assume June as well. So what is the bottom line? Some 23,000 to 28,000 homes per month that are foreclosed or now owned by the bank don’t make their way to the public MLS! That is why in this short time frame, we see the actual public data dwindle because organic sales from non-distressed properties are accounted for, but the building distress market is kept off the books and this is enormous. In fact, the MLS data is well accounted for:
Non-distress CA homes sold:
March: 15,428
April: 17,048
May: 19,096
June*: 17,191 (running average from previous 3 months)
Total: 68,763
And this would make sense since in our tiny subset, we accounted for 44,000+ homes that came off the MLS in this timeframe without including all California counties. Yet this is tremendously deceiving to the public. The pundits are spinning this data just like they spin the terrible unemployment numbers and are saying look at how quickly inventory is dropping. Well sure, this is the only data that we can see. But knowing the rest of the story we know that some 23,000 to 28,000 foreclosed properties are sitting somewhere either being sold off in bulk to investors or simply put, just sitting. We know that looking at closed escrow sales data that over half of the market is foreclosed properties so this is the market. I’m not the only one seeing this:
“(LA Times) The percentage of Los Angeles County mortgages delinquent by 90 days or more in May was nearly double the rate last year, First American CoreLogic reported today.
May’s 9.5% delinquency rate for L.A. County was up from 5% of mortgages late by 90 days or more in May 2008. First American bases its foreclosure analyses on public records.
While the default rate has nearly doubled, the number of homes actually being sold at auction — the final foreclosure stage — has shrunk. In May, the L.A. County repossession rate was down to 1% of mortgages, from 1.1% a year ago. This discrepancy is the “foreclosure backlog” now looming over the housing market. It’s caused by various government-mandated and voluntary foreclosure moratoriums, and possibly by lenders trying to manage the flow of repossessed homes entering the market.
Nationally, First American reported 6.5% of mortgages were in default in May, up from 4% in May 2008. The national repossession rate was 0.7% in May, up from 0.6% in May 2007.”
The amount of inventory being kept off the public view is simply enormous. This is going to end badly for a state with a massive fiscal budget problem. I have yet to see any deeper analysis trying to pinpoint the actual figure since it is hard to get any accurate figures from banks, but looking at data we know to be true, we know something is absolutely rotten in Denmark.


