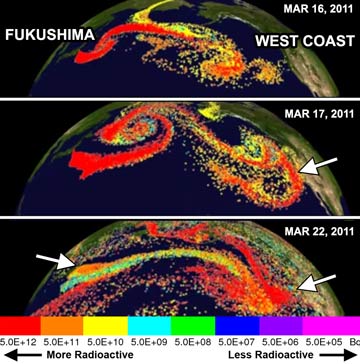
Gov’t model shows airborne radioactive plume covering entire west coast of US & Canada on Mar 22, 2011… 10 times more radioactive than plume coming from Fukushima plant on same day — Radiation levels in some plumes had no discernible decrease after crossing Pacific (VIDEO)
ENE News
Fukushima Radioactive Aerosol Dispersion, NOAA: The [HYSPLIT] model was developed by NOAA to follow the transport and dispersion of pollutants in the atmosphere. In HYSPLIT, the computation is composed of four components: transport by the mean wind, turbulent dispersion, scavenging and decay. A large number of pollutant particles, which by convention are called “particles” but are just computational “points” (particles or gases), are released at the source location and passively follow the wind. [...] March 11th [...] by 16:36 a nuclear emergency was reported. By the early morning hours of March 12th, radioactive emissions were occurring [...] the simulation from NOAA’s HYSPLIT model shows a continuous release of tracer particles from 12-31 March at a rate of 100 per hour representing the Cesium-137 emitted from Fukushima Daiichi. Each change in particle color represents a decrease in radioactivity by a factor of 10.
Notable Features
- Particles with the highest radioactivity were released around March 15th [See also: UN: Fukushima Unit 2 reactor “burst” on March 15th after fuel melted — Radiation doses soon hit highest levels of crisis for many places across region]
- Particles caught in clockwise circulations are embedded in fair weather high pressure systems and their radioactivity will persist for longer periods
- In general, radioactivity reaching the United States showed air concentrations over 1000 times smaller than areas near Japan
The March 22, 2011 NOAA model (above right) shows the West Coast of US and Canada covered in red particles, while the Fukushima site — and all of Japan — are under orange particles. According to the NOAA above a “change in particle color represents a decrease in radioactivity by a factor of 10”
Watch NOAA’s Fukushima airborne plume simulation here
Published: April 8th, 2014 at 8:16 am ET
By ENENews

