

COMPARING THE COST OF LIVING BETWEEN 1975 AND 2O15: YOU ARE BEING LIED AND FOOLED WHEN IT COMES TO INFLATION DATA ANDTHE COST OF LIVING
My Budget 360
Inflation is widely misunderstood by the public. Even economists tend to have a hard time coming to a general agreement to the true definition of inflation. When you ask the person on the street what inflation is they usually respond by saying the “price of things going up” which is more of a consequence of inflation, rather than the cause. Inflation is like a new car that lacks maintenance. At first, there is little notice of the issue but overtime major problems start occurring and eventually the car breaks down. If you want to see inflation out of control just look at Venezuela right now where people are swarming stores for basic food items. In the US inflation has occurred primarily because of the Federal Reserve’s banking policy. Too much cash (or debt in this case) chasing the same amount of goods. Only when we look at longer periods of time do we see the insidious nature of inflation. Yet somehow, the data used to measure inflation misses much of what is happening because it uses derivative like measures. For example, we use the owners’ equivalent of rent (OER) instead of the true monthly cost of owning a home. Let us take a look at some data between 1975 and 2015.
The cost of living shuffle
We continually hear about the middle class shrinking. But where are they shrinking to? Much of the disappearing act has come at the hands of inflation. That is, their income is no longer sufficient to support the items that we once categorized as part of the middle class: a car, a home, college education for the kids, and basic healthcare. For many Americans, these items are all getting out of reach. And for those that purchase them, they are required to go into massive debt with banks.
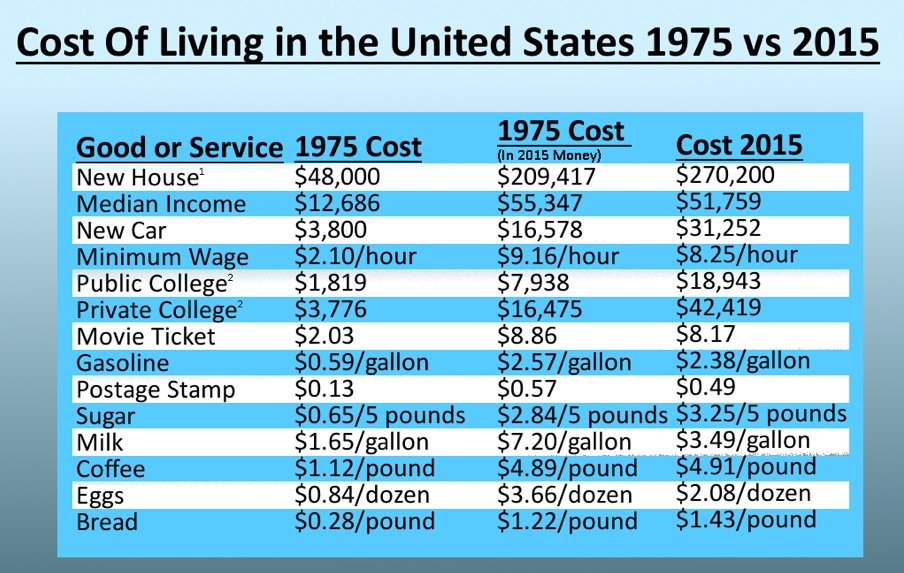
There is an interesting chart looking at the cost of items in 1975 versus today:
Source: David Stockman
This is a very telling chart. First, let us look at the biggest line item with housing. A new home today costs $270,200. That 1975 home adjusting for inflation would cost $209,417. This is a “real” increase of 29 percent. A new car costs $31,252 while that 1975 car adjusting for inflation would cost $16,578. This is a true doubling of cost here. Public college costs are up over 150% while private college costs are up over 160%. And you wonder why we have over $1.3 trillion in student debt outstanding.
What is more affordable relative to inflation? Milk, eggs, and a postage stamp. Unfortunately these are tiny line items on your household budget.
What you need to look at is the median income here. US households overall are simply poorer. They have less to spend relative to the cost of goods and services. Money is only as good as what it can purchase. You can’t eat hundred dollar bills. This is part of the reason why many people feel like they are poorer. It is also a big reason as to why the homeownership rate continues to fall.
The Fed uses the Consumer Price Index (CPI) to gauge if inflation is within range. Take a look:
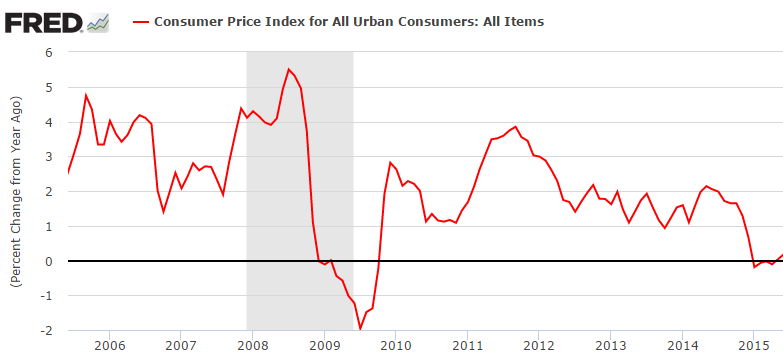
According to recent data, we have nearly no inflation! How about that. Well look at the above chart. We have some major inflation going on but recent policy is dictated by recent changes in inflation. And you are also missing out on bigger changes like many young Americans having most of their debt and spending being consumed by college. The CPI gives only a tiny portion allocation to college education. Keep in mind the CPI is a weighted basket. So this misses out on a large cost for millions of Americans.
But look at even more recent data:
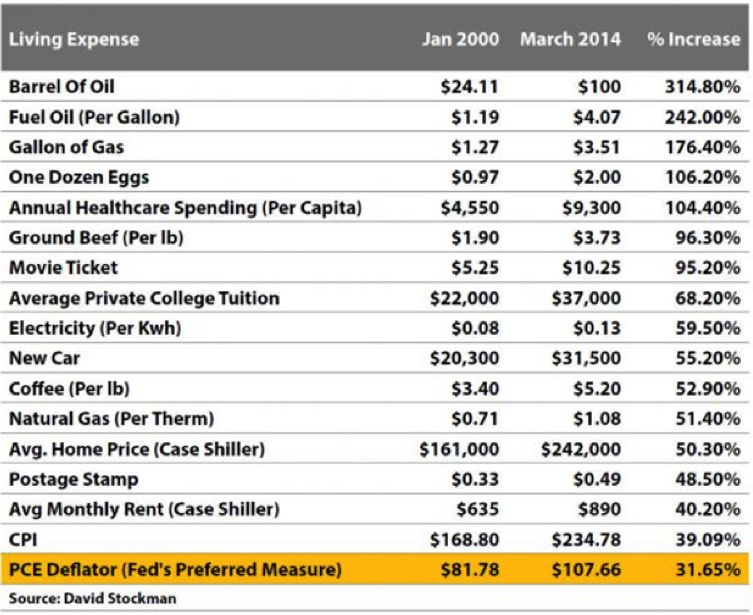
This is looking at price changes since 2000 and goes out to 2014. A barrel of oil has plunged since this chart was made (still up 100 percent from 2000). Ironically the savings aren’t passed to consumers since a gallon of gas is still expensive. The average home price is up more than 50 percent. Average monthly rent is up more than 40 percent. That new car is up more than 55 percent. Healthcare spending is up 100 percent. Yet the overall CPI rate is up 39 percent. You see how this misses out on the true changes in the market?
Gradual change is the name of the game with inflation. Slowly the nation is being owned by massive amounts of debt (meaning banks have full control over the public if they wish to buy a home, car, or even go to college). Credit card debt is once again surging. That is a lot of power to those controlling debt and given the rising cost of goods and stagnant incomes, people need debt to purchase the artifacts of what was once middle class living.
http://www.mybudget360.com/cost-of-living-compare-1975-2015-inflation-price-changes-history/