

JP Morgan Loses 45% Of Registered Gold Stock In One Day
While the drain of COMEX gold and silver Registered inventories continues as demand for physical precious metals increases, JP Morgan experienced a 45% decline of its Registered Gold Inventories in one day. JP Morgan now only has a lousy 10,777 oz of gold remaining in its Registered gold inventories.
Basically, JP Morgan holds 1/3 metric ton of gold in its Registered inventories. This is the reason we are seeing the paper gold ratio on the COMEX above the 250/1 ratio. If we look at the COMEX warehouse table below, we can see just how little Registered Gold remains on the exchange:
*
*
*
*
*
*
*
*
*
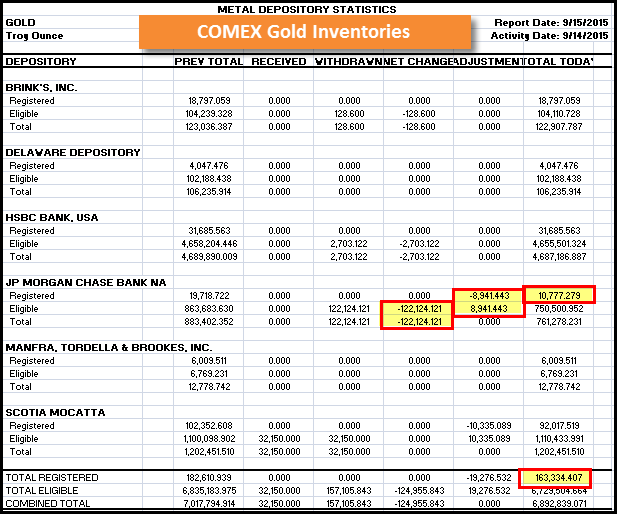
Not only did JP Morgan suffer a 45% reduction (8,941 oz) of its Registered Gold inventories, it also experienced a 122,124 oz withdrawal from its Eligible stocks. We must remember, its JP Morgan’s Registered Inventories that are available for delivery into the market, not its Eligible.
Currently, the COMEX holds a total of 163,334 oz (5 metric tons) of gold in its Registered inventories for ALL BANKS… LOL.
COMEX Silver Registered Inventories Plunged Again Today
If you read my article, Stunning Development in the U.S. Silver Market, you would have seen this chart below:
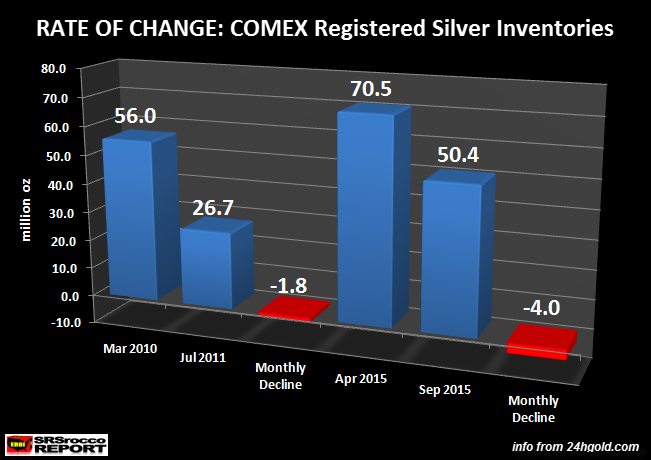
As of yesterday, there were 50.4 million oz (Moz) of silver stored as Registered inventories at the COMEX warehouses. What is interesting about the current drain of COMEX Registered silver inventories, is that its average monthly decline rate of 4 Moz (per month) is more than double the previous decline from March 2010 to July 2011 of 1.8 Moz per month.
For whatever reason, the Registered silver inventories are declining at a much faster pace than they were during the huge price spike in 2011, even though the price of silver is trading at $14-$15 while industrial silver demand is falling.
Today’s COMEX silver warehouse update was another whopper:
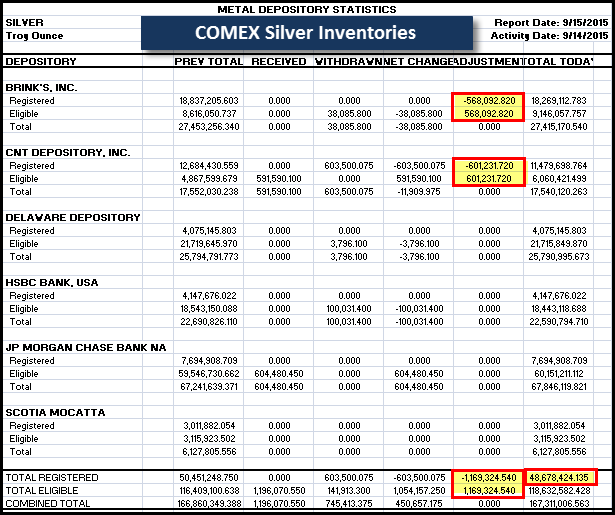
While the exchange experienced a net 450,657 oz deposit of silver, the important figures to focus on are the decline in Registered inventories. Brinks transferred 568,092 Registered silver to its Eligible category and the CNT Depository withdrew 601,231 oz for a total of 1,169,324 oz.
The total Registered silver inventories at the COMEX are now at 48.6 Moz compared to a high of 70.5 Moz in April. As I stated above, the average monthly decline rate of silver out of the COMEX Registered was 4 Moz. However, in one day it fell nearly 1.2 Moz.
With India importing record amounts of silver as well as the huge surge of physical silver investment demand, it is putting stress on the 1,000 oz wholesale market. It will be interesting to see the Fed rate hike decision on Thursday and its impact on the precious metals.
If the Fed raises or keeps rates the same, I believe we will continue to see more stress on the wholesale precious metals market. We live in interesting times.
THE SILVER CHART REPORT: No Other Report Like It On The Internet
If you haven’t checked out THE SILVER CHART REPORT, there’s a great deal of information on the Silver Industry & Market not found in any single publication on the internet. There is one chart in this report (Chart #19) that I can guarantee that 99.9% of precious metal investors haven’t seen before.
 Most analysts focus on a certain area or sector of the silver market. However, the information in this report illuminates a holistic view of many sectors of the silver industry, capturing the relationships that connect many parts of the market.
One of the important aspects of my work is to look at many industries and markets from a bird’s-eye view. From this perspective, we can see how industries and markets impact each other to a much larger degree than by just focusing on individual sectors.
CLICK HERE: For The Silver Chart Report
I use this bird’s-eye approach when I create my easy to understand charts. The Silver Chart Report is a collection of my top silver charts from articles published over the past six years, and includes in-depth, never-before-seen charts and content that indicate that silver is on the rise. There are 48 charts in the report, broken down in five sections.
Please check back for new articles and updates at the SRSrocco Report. You can also follow us at Twitter below:
https://srsroccoreport.com/jp-morgan-loses-45-of-registered-gold-stock-in-one-day/